Case Studies

First Principles thinking applied to real problems.
The methodology proven, the results measured.

Portfolio

Intelligence in Action

Four live, deployed projects — each demonstrating the EDON methodology: Deconstruction, Synthesis, Hardening, and Integration applied to real-world complexity across climate, fintech, and blockchain systems.

01
Climate Intelligence Featured
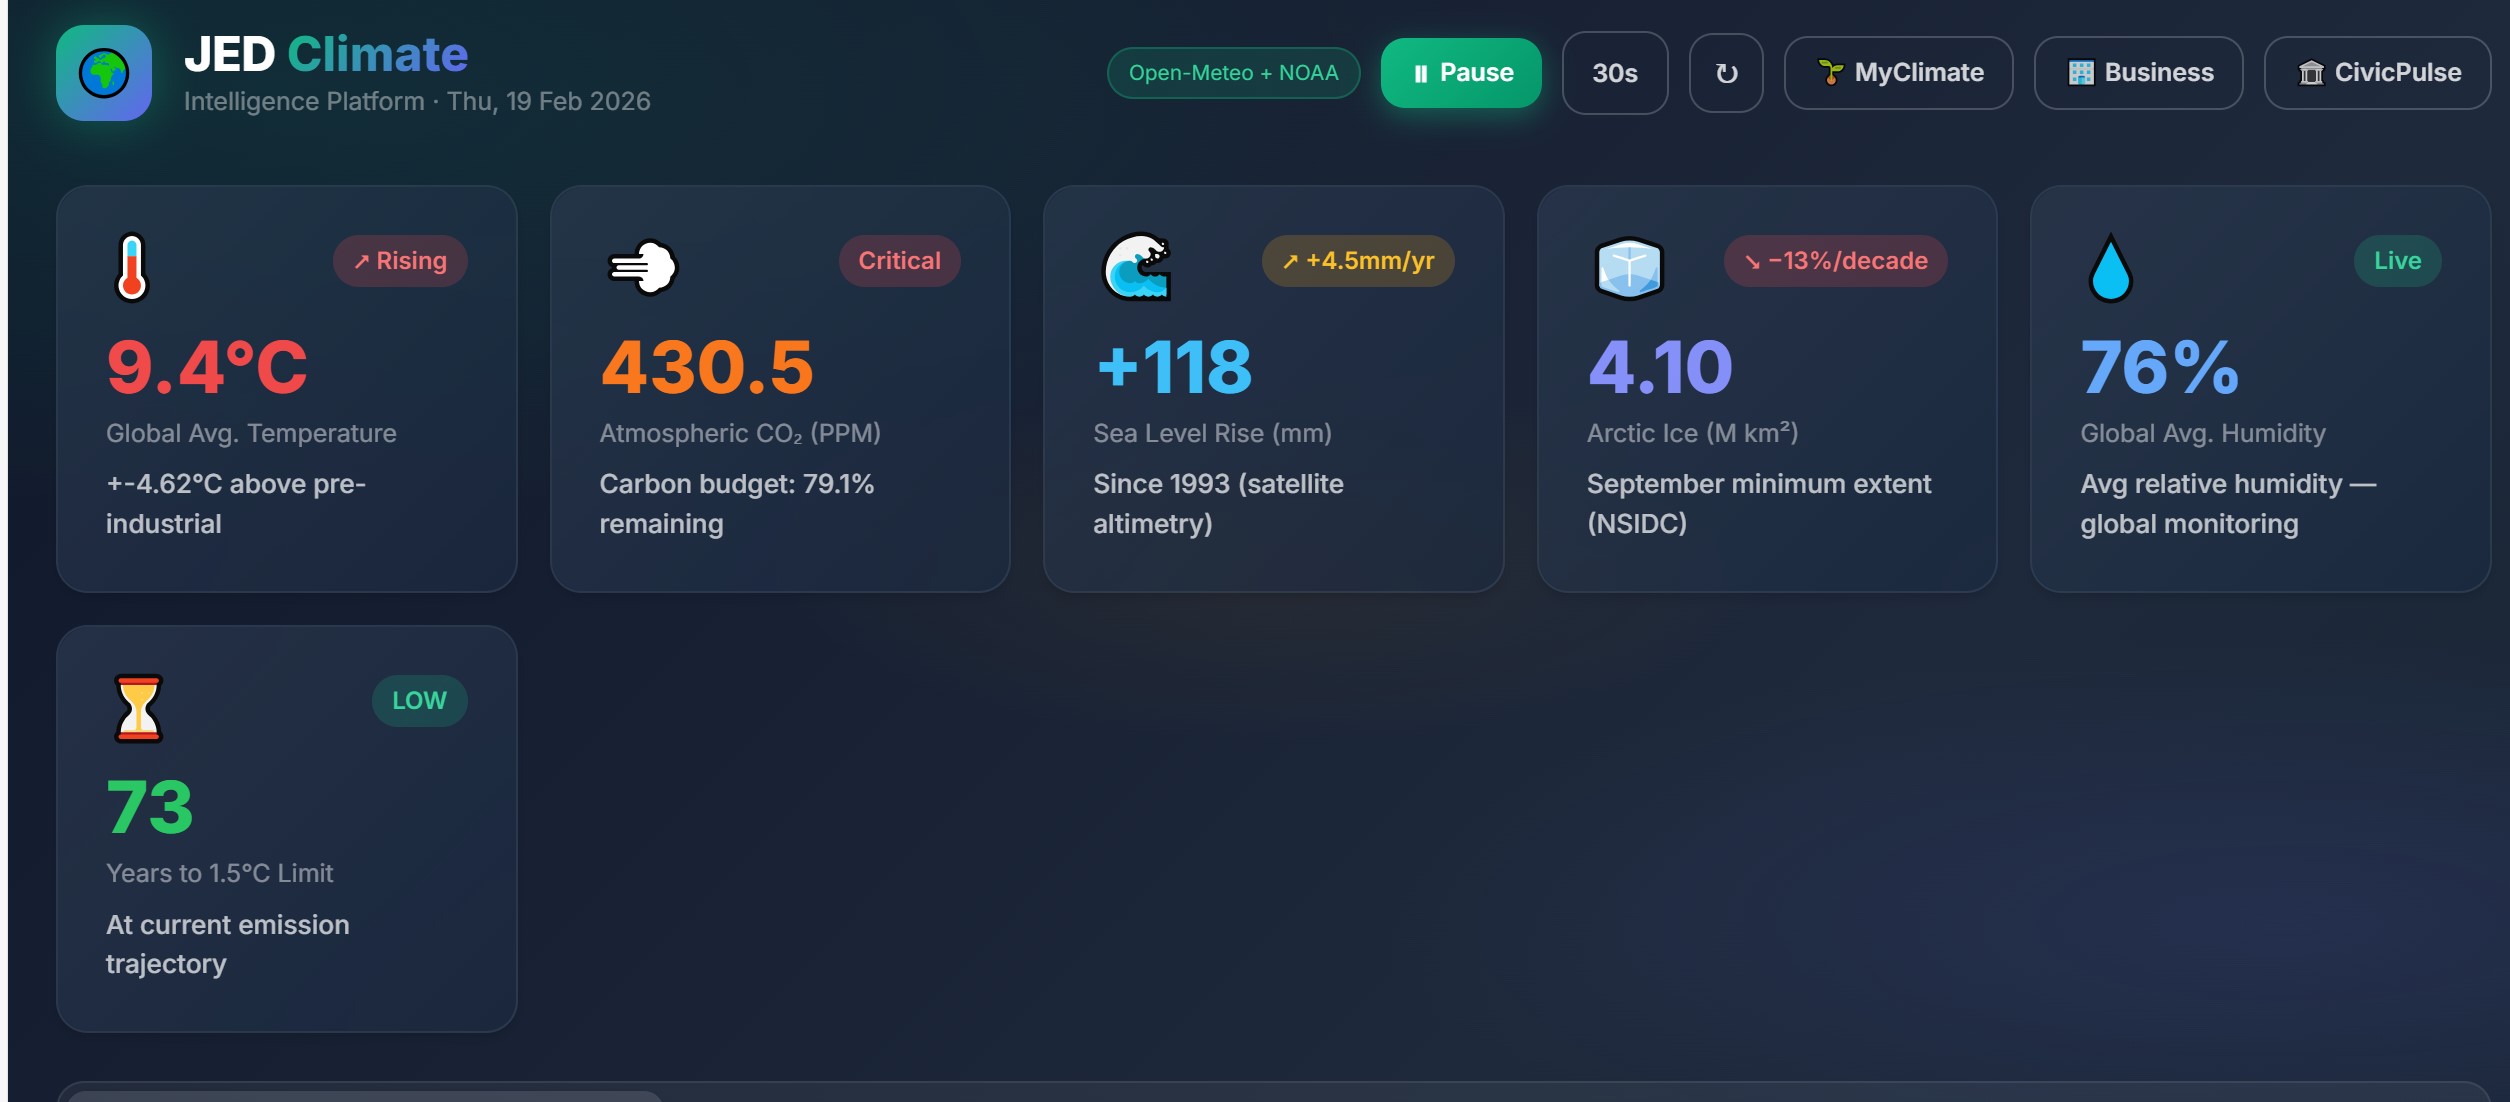
JED Climate Intelligence Platform dashboard

JED Climate — Full-Stack Climate Intelligence Platform

A production-grade climate intelligence platform with four interactive dashboards (Global, Personal, Corporate ESG, Civic Policy), a .NET 8 microservices backend, Python AI/ML services, and Azure cloud infrastructure — all deployed to Vercel.

React 18 .NET 8 FastAPI Azure TypeScript TensorFlow
Read Full Study
02
Fintech / ML Security Featured
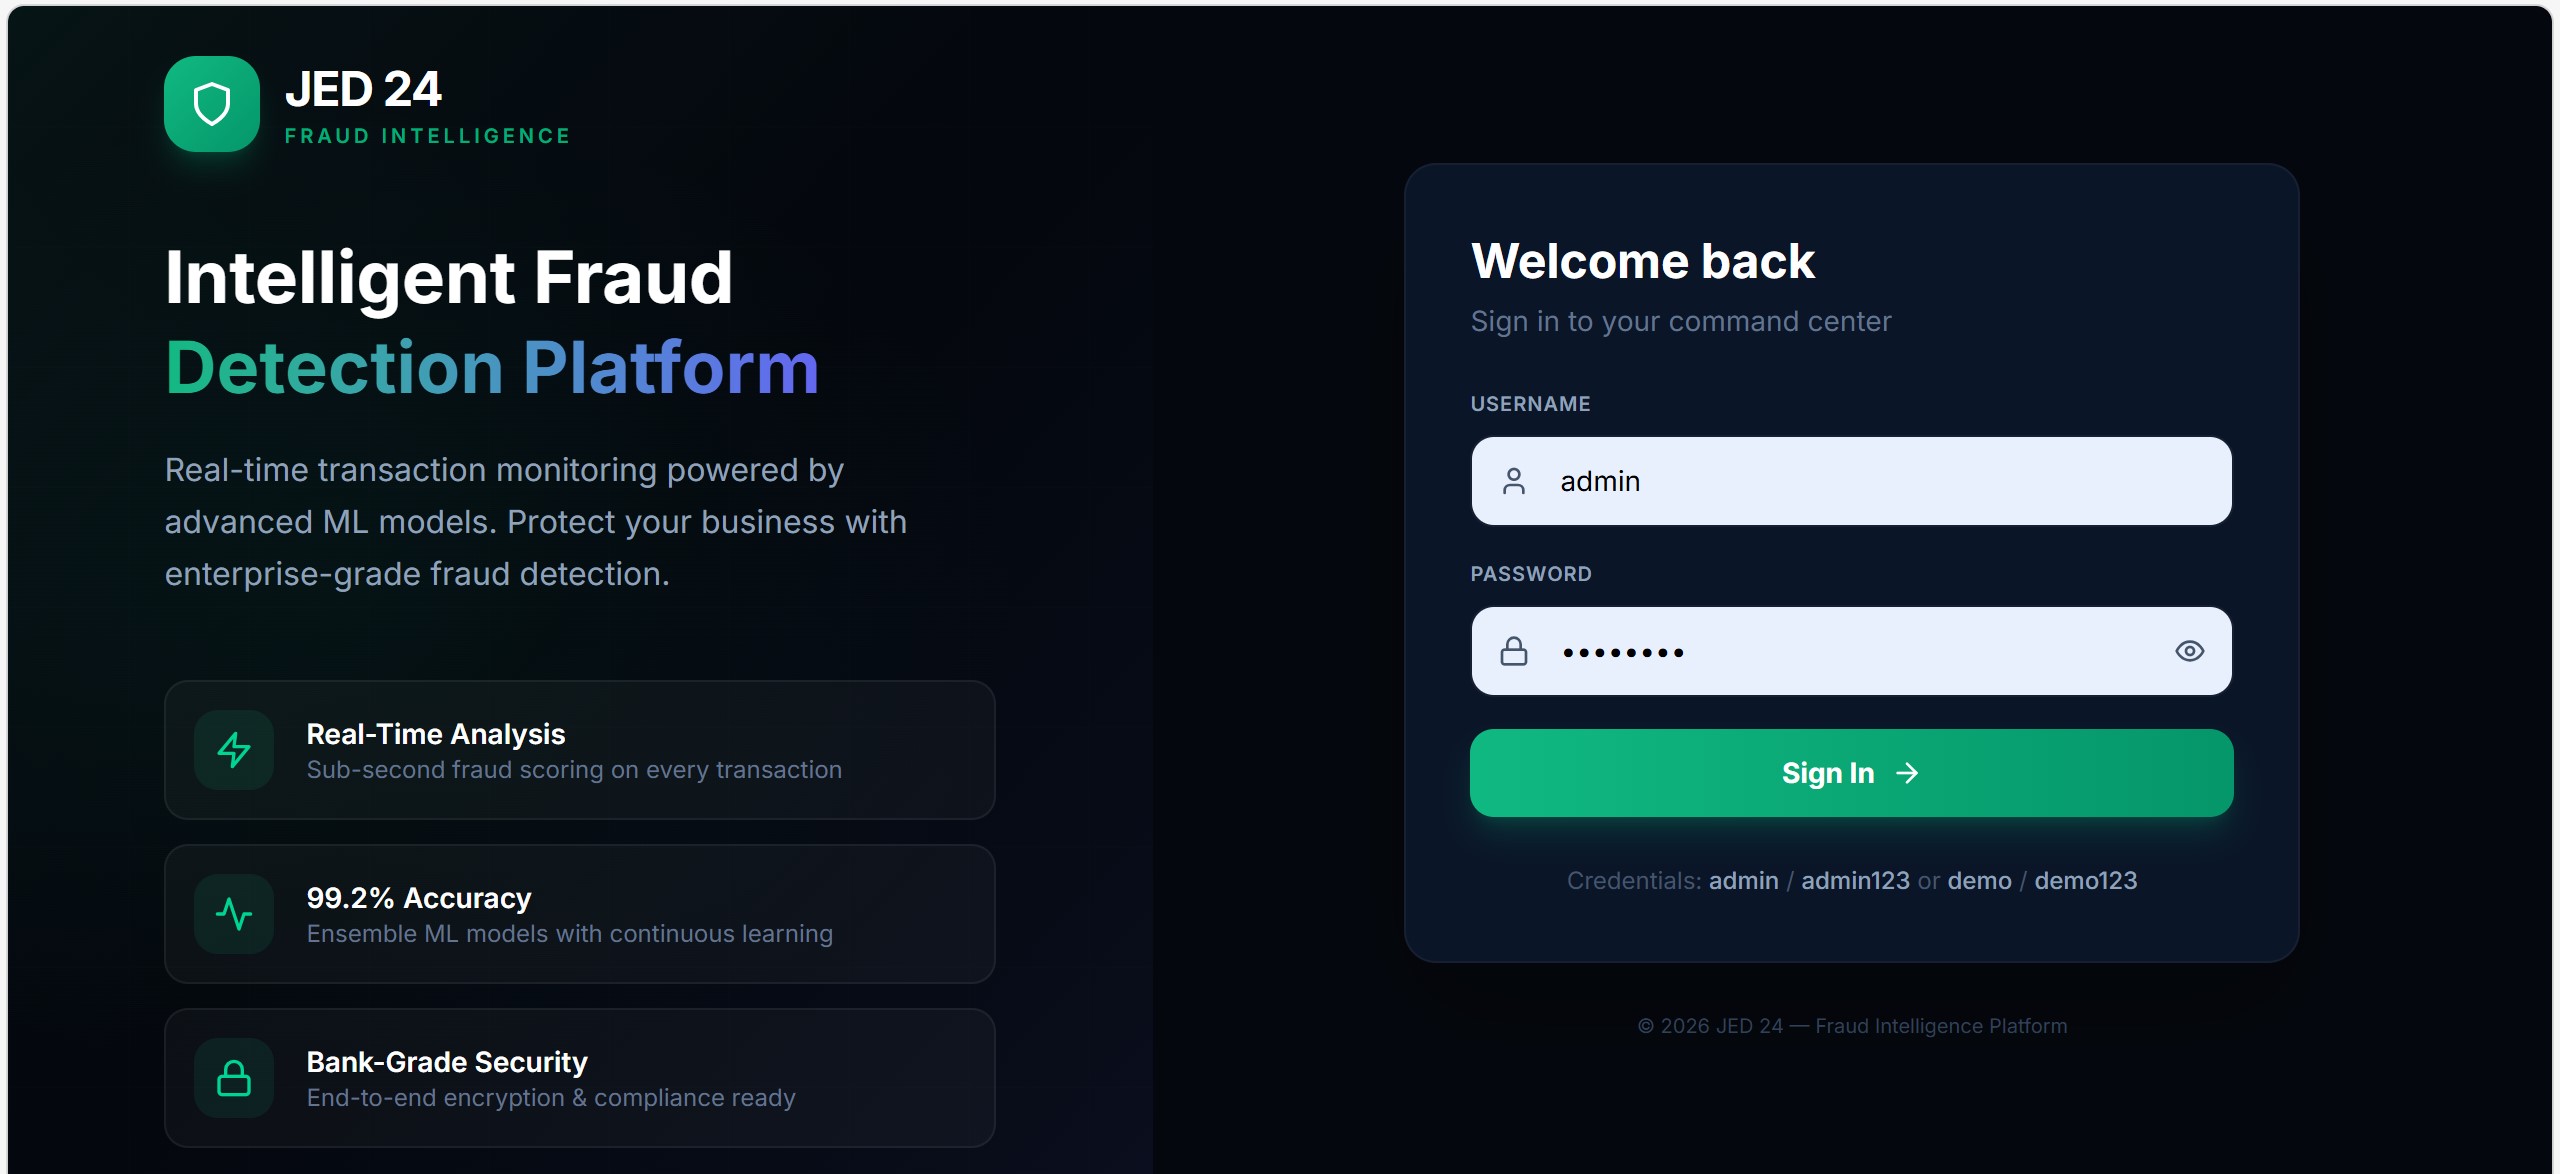
Fintech Fraud Detection System dashboard

Autonomous Fraud Detection System for Fintech

Production-grade ML fraud detection with ensemble models (XGBoost, Random Forest, Neural Networks), privacy-preserving AI (Differential Privacy, Federated Learning), <50ms inference latency, and full regulatory compliance (GDPR, PCI-DSS).

Python XGBoost SHAP FastAPI Federated Learning Differential Privacy
Read Full Study
03
Blockchain / AI Agent Live
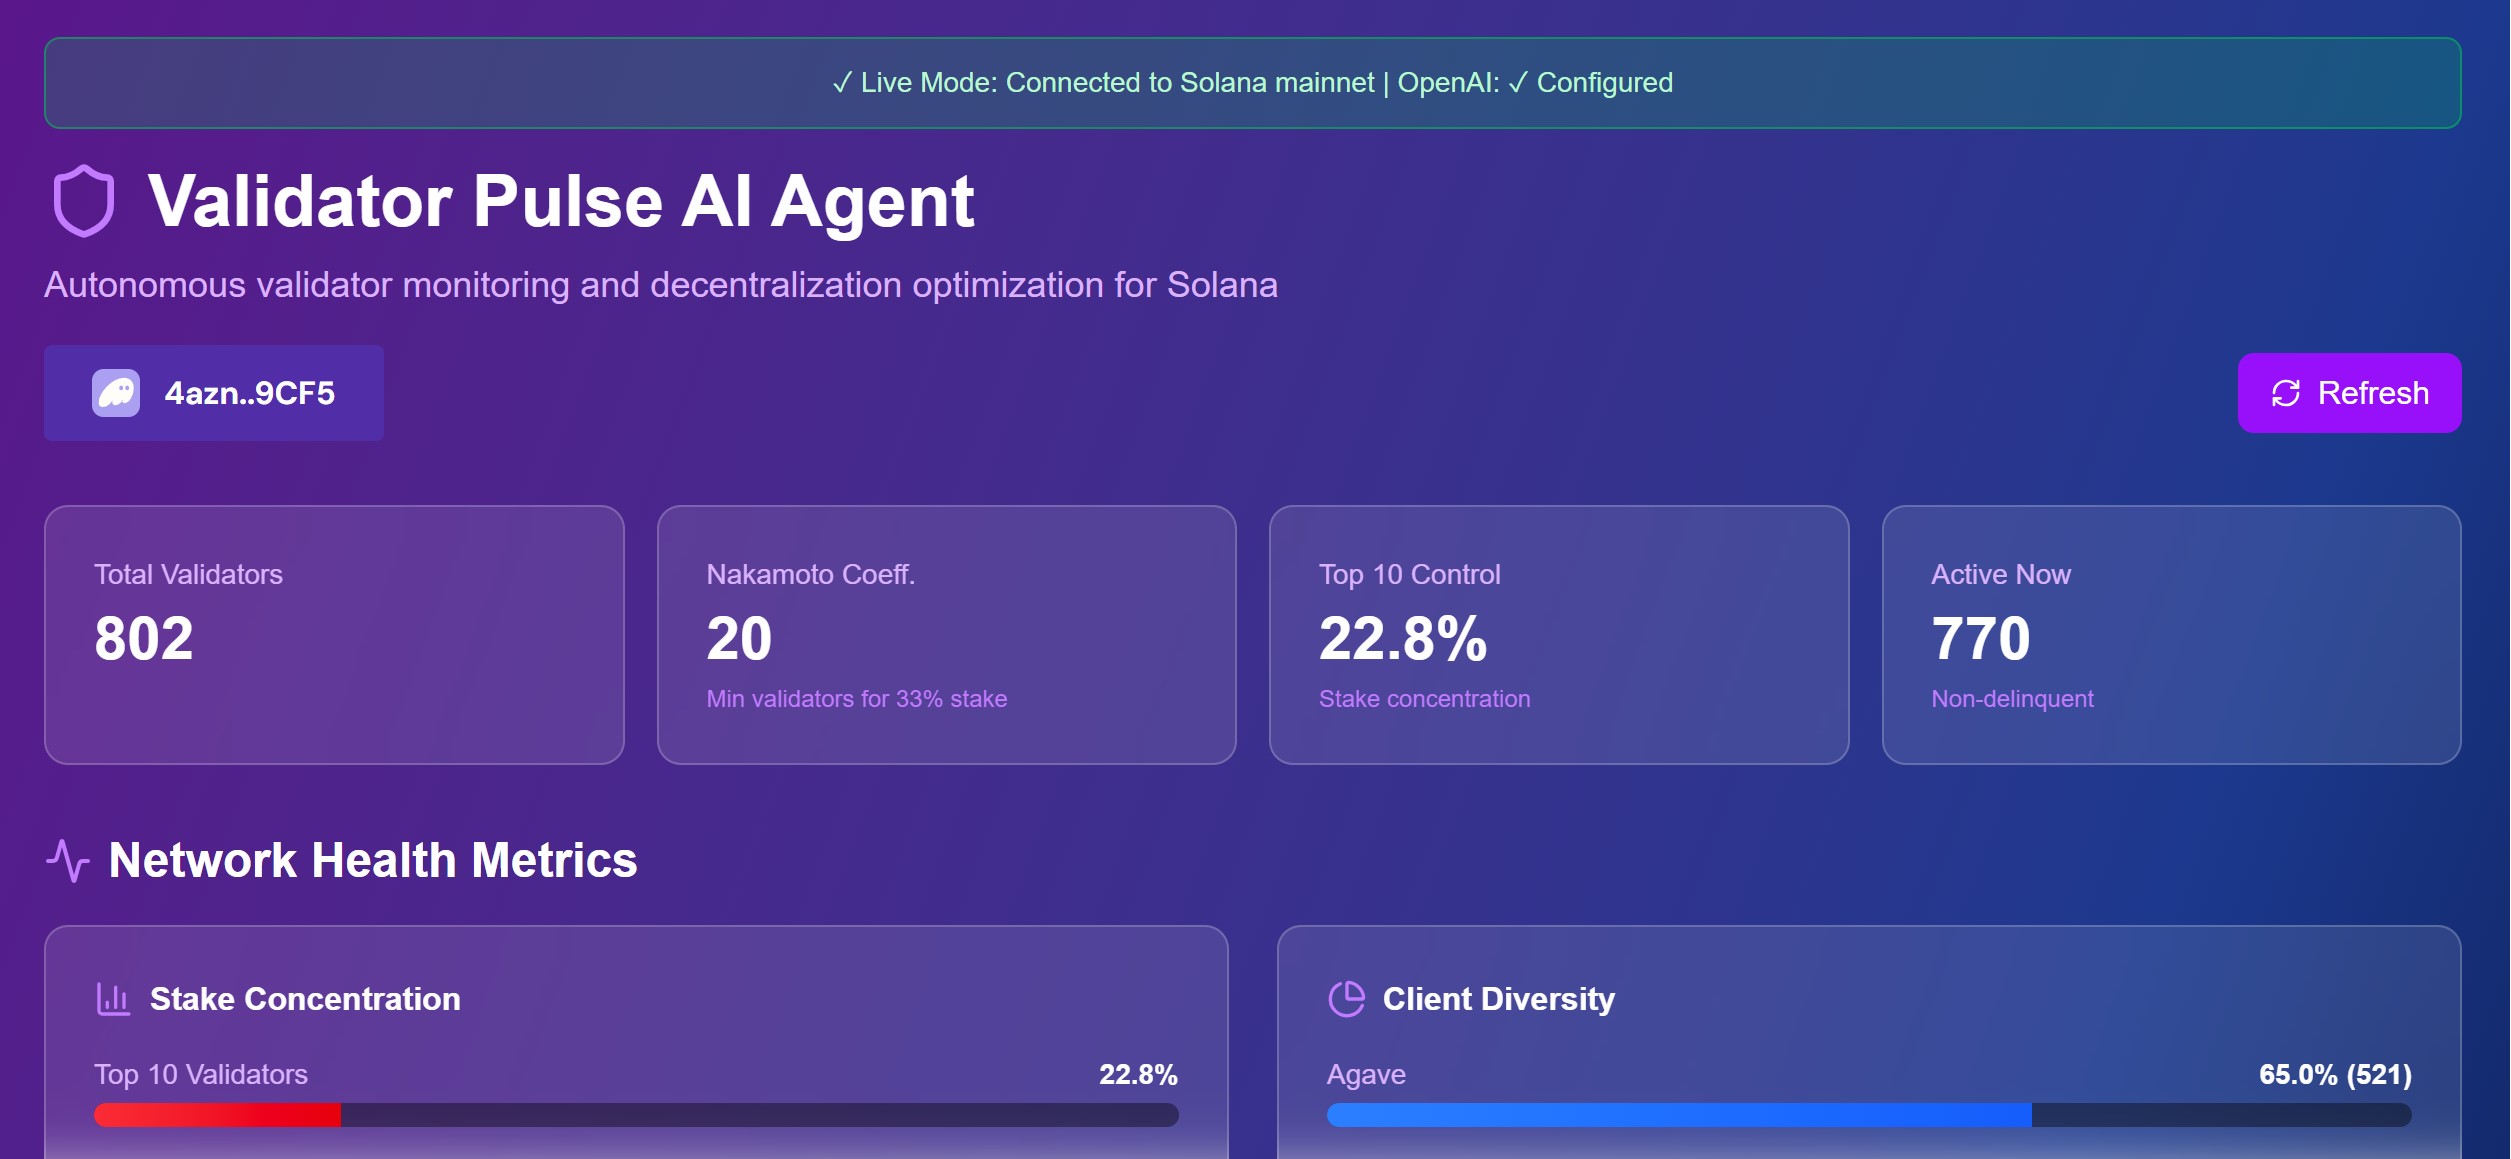
Validator Pulse AI Agent Solana dashboard

Validator Pulse AI Agent — Solana Decentralization

Autonomous AI agent monitoring 798 Solana validators in real-time, applying a 4-dimensional scoring algorithm (88% confidence) to optimise stake decentralization across geographic, performance, client, and stake dimensions.

Next.js GPT-4o Solana TypeScript Supabase Alchemy RPC
Live App
04
Economic Intelligence Live
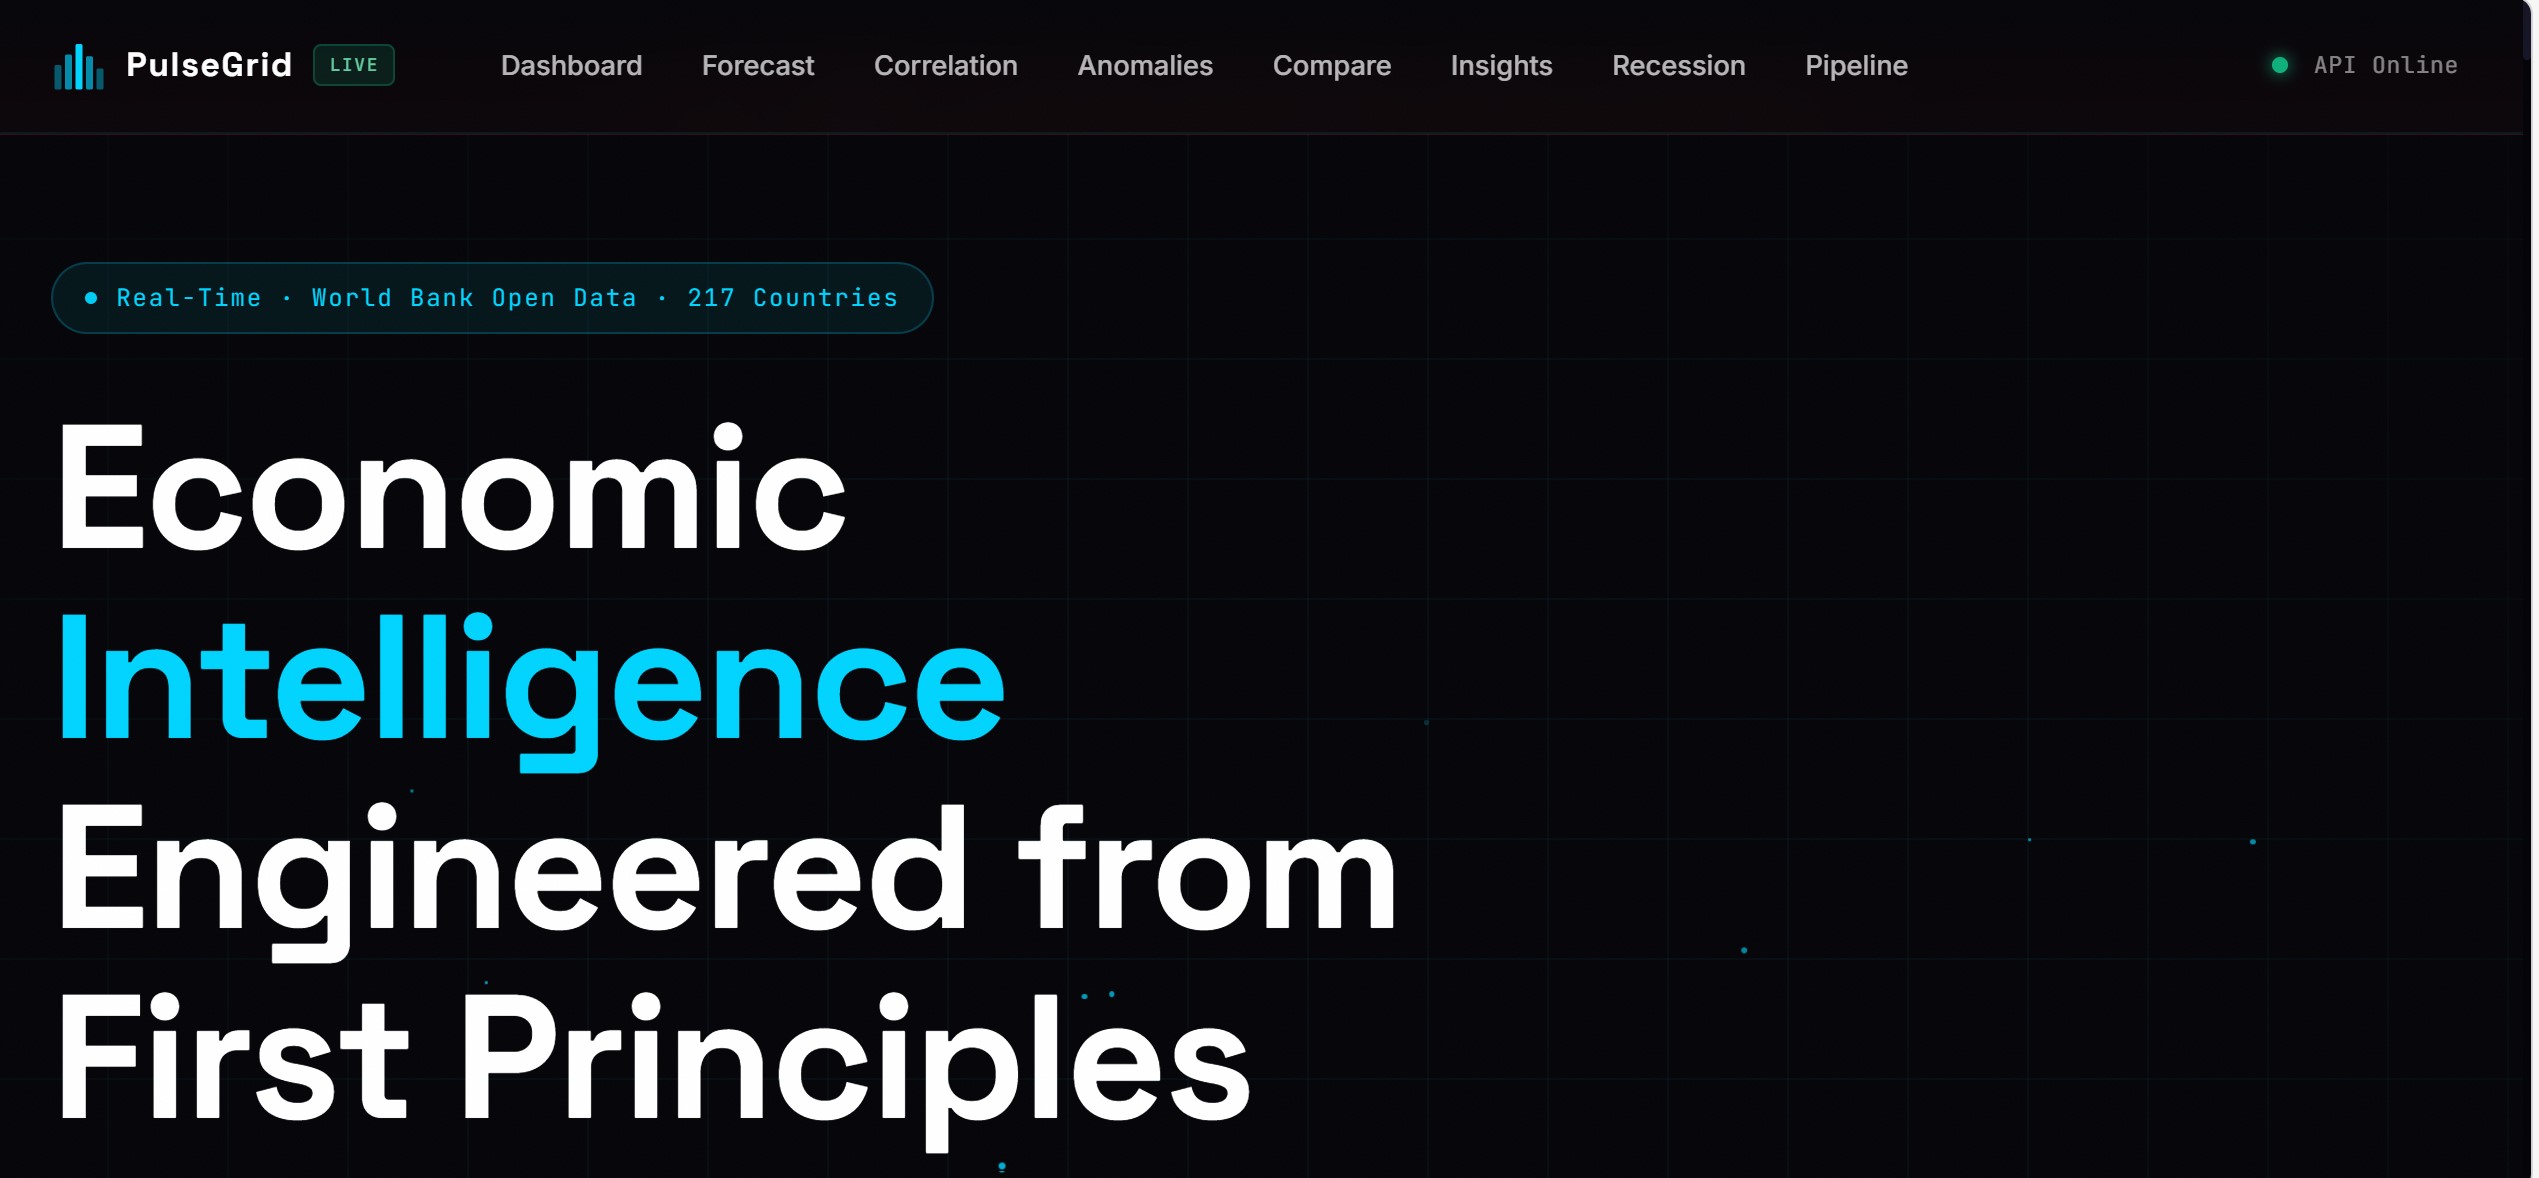
PulseGrid Global Economic Intelligence Platform

PulseGrid — Global Economic Intelligence Platform

A production-grade economic intelligence platform powered by World Bank data, featuring automated ETL pipelines, statistical engines (Granger causality, cointegration, impulse-response), natural language generation, and interactive multi-country dashboards with 60+ years of macroeconomic data.

Python Flask Pandas Statsmodels D3.js World Bank API
Read Full Study
Case Study 01 — Climate Intelligence

JED Climate — Full-Stack Climate Intelligence Platform

Domain Climate / ESG / Civic Policy
Stack React · .NET 8 · FastAPI · Azure
Role Lead Architect & Engineer
Status Live on Vercel

01 The Challenge

Climate data is fragmented across academic, governmental, and commercial sources — meteorological readings, CO₂ projections, corporate ESG disclosures, and civic policy indices exist in isolation. Individuals, businesses, and governments each need fundamentally different intelligence from the same underlying data, yet no unified platform translates the raw signal into actionable, domain-specific insight.

The problem compounds at scale: any platform must simultaneously serve a personal user tracking their carbon footprint, a corporation managing Scope 1–3 emissions, and a government official benchmarking Paris Agreement progress — each with distinct data models, visualisations, and latency requirements, all from a single truth source.

02 The First Principles Approach

The first step was deconstruction: decompose "climate intelligence" into its four irreducible user contexts — Global (physical systems), Personal (behavioural carbon), Corporate (ESG supply chain), and Civic (policy governance). Each context demands a separate data model and intelligence layer, not a single monolith trying to serve all four.

Synthesis produced a microservices architecture where each domain owns its data pipeline and ML service, coordinated through an Ocelot API Gateway with per-route rate limiting and circuit breaking. The frontend consumes all four through a single React SPA with lazy-loaded routes — minimising initial load while maintaining runtime separation.

Hardening required JWT authentication at the gateway layer, Azure Key Vault for secrets management (no credentials in code), TLS 1.2 enforcement, VNet isolation, and per-route timeout enforcement — production-grade security from day one.

03 Technical Implementation

The frontend is a React 18 + TypeScript 5 SPA using Framer Motion for page transitions, Recharts for six interactive chart types (Area, Bar, Line, Radar, Pie, RadialBar), and a custom ResponsiveChart wrapper built on ResizeObserver for reliable responsive rendering without layout thrash.

The backend spans four .NET 8 microservices (myclimate, businessnexus, civicpulse, identity) behind an Ocelot API Gateway handling JWT auth, rate limiting (10–200 req/min per route), QoS circuit breakers, and service discovery via Consul. Async messaging between services runs through MassTransit on Azure Service Bus.

The AI/ML layer is a FastAPI + Uvicorn analytics engine with TensorFlow 2.15, PyTorch 2.1, scikit-learn, Prophet (time-series forecasting), and GeoPandas for geospatial climate data processing. Infrastructure is fully codified: modular Bicep templates deploy Container Apps (auto-scale 1–10), Azure SQL, Cosmos DB, Redis, Key Vault, and CDN through a single azd up.

Technologies Used

React 18 + TypeScript .NET 8 / ASP.NET Core FastAPI + Uvicorn TensorFlow 2.15 Prophet (Time Series) GeoPandas Azure Container Apps Azure Bicep / AZD Ocelot API Gateway Recharts Docker Compose (14 services) PostgreSQL + Cosmos DB

04 Results & Impact

JED Climate is the most technically comprehensive project in the EDON portfolio — a 14-service full-stack platform spanning frontend, microservices, ML/AI, and cloud infrastructure, all deployed and live. It demonstrates the EDON First Principles methodology at enterprise scale.

4 Live Intelligence Dashboards
14 Microservices Orchestrated
6 Interactive Chart Types
azd up Full Cloud Deploy

"Climate data is not a display problem — it's a modelling problem. Four user contexts require four data models and four ML layers, not one dashboard trying to be everything to everyone."

— John Edoh Onuh, EDON

Case Study 02 — Fintech / ML Security

Autonomous Fraud Detection System for Fintech

Domain Financial Crime / ML Security
Latency <50ms p95 inference
Accuracy 97.5% · 94.2% recall
Throughput 10,000+ TPS

01 The Challenge

Fraud detection in regulated financial environments sits at the intersection of four competing constraints: accuracy (catching fraud), privacy (not exposing customer data), latency (<100ms for real-time transaction scoring), and explainability (regulators require auditable model reasoning). No single off-the-shelf model satisfies all four simultaneously.

The additional complication: financial fraud patterns exhibit concept drift — attacker strategies evolve faster than static models retrain. A system built on assumptions made at training time will degrade in production on the timescale of weeks.

02 The First Principles Approach

The fundamental physics of financial fraud: fraud is an anomaly in a high-dimensional transaction signal space. The first-principles question is not "what rule flags this transaction?" but "what is the underlying statistical structure of legitimate transactions, and where does this transaction deviate?"

This reframing led to an ensemble architecture — combining XGBoost (gradient-boosted trees for tabular pattern recognition), Random Forest (variance reduction), and a Neural Network (non-linear feature interaction) — each trained on different representations of the same transaction signal. The ensemble aggregates their outputs with SHAP-informed weighting, giving regulators a human-interpretable explanation for every decision.

Privacy-by-design was applied at the model level, not the infrastructure level: Differential Privacy (ε=1.0) calibrates noise injection during training to provide formal privacy guarantees. Federated Learning enables multi-institution model training without any institution exposing raw transaction data.

03 Technical Implementation

The inference stack is a FastAPI + Uvicorn API with AES-256 encrypted request pipelines, sub-100ms response (p99), and a streaming Kafka-compatible event architecture for real-time transaction ingestion. Each inference call returns a SHAP explanation vector alongside the fraud score — enabling both automated action and human review.

Concept drift detection monitors model performance in production and triggers federated re-training when statistical drift is detected, closing the feedback loop without requiring manual intervention or data centralisation. The monitoring layer exports Prometheus-compatible metrics for full observability.

Technologies Used

Python XGBoost Random Forest TensorFlow / PyTorch SHAP / LIME Differential Privacy (ε=1.0) Federated Learning (PySyft) FastAPI + Uvicorn Kafka (Streaming) Prometheus Metrics AES-256 Encryption Docker / Kubernetes

04 Results & Impact

The system delivers production-grade performance across all four constraint axes — accuracy, privacy, latency, and explainability — simultaneously, which is the key first-principles result: proving that these constraints are not fundamentally in tension when the system is designed correctly from the ground up.

97.5% Model Accuracy
94.2% Fraud Recall Rate
<50ms Inference Latency (p95)
10K+ Transactions/Second

"Privacy and accuracy are not a trade-off — they are a design choice. Differential Privacy adds calibrated noise at training time while maintaining 95%+ accuracy. The tension only exists if you add privacy as an afterthought."

— John Edoh Onuh, EDON
Case Study 04 — Economic Intelligence

PulseGrid — Global Economic Intelligence Platform

Domain Macroeconomics / Policy Intelligence
Stack Python · Flask · D3.js · Statsmodels
Data World Bank · 60+ years
Countries 200+ economies

01 The Challenge

Global economic data — GDP, inflation, trade balance, unemployment — is scattered across dozens of institutional databases, published in incompatible formats, and rarely analysed with the statistical rigour it deserves. Policymakers, researchers, and analysts routinely make decisions based on surface-level trends rather than the causal mechanisms driving economic change.

The fundamental question: can we build a system that automatically ingests authoritative economic data, applies publication-grade statistical methods, and generates human-readable intelligence — closing the gap between raw numbers and actionable insight?

02 The First Principles Approach

Economic indicators are not independent variables — they form a complex causal web where GDP growth, inflation, interest rates, and trade balances co-evolve through feedback loops. The first-principles insight: any meaningful economic analysis must model these interdependencies explicitly, not merely chart each indicator in isolation.

This reasoning led to a statistical engine built on four pillars: Granger causality testing (does X predict Y?), cointegration analysis (do variables share a long-run equilibrium?), impulse-response functions (how does a shock in one variable propagate?), and variance decomposition (what explains the variance in each indicator over time?).

03 Technical Implementation

PulseGrid runs an automated ETL pipeline against the World Bank API, ingesting and normalising macroeconomic indicators across 200+ countries with 60+ years of historical data. The statistical engine (Statsmodels, SciPy) performs VAR modelling, ADF stationarity tests, Johansen cointegration, and Granger causality — all triggered automatically per country-indicator pair.

A Natural Language Generation (NLG) layer translates statistical outputs into plain-English narrative summaries, making complex econometric results accessible to non-technical stakeholders. The frontend delivers interactive D3.js dashboards with multi-country comparison, time-series visualisation, and drill-down analysis.

Technologies Used

Python Flask Pandas / NumPy Statsmodels SciPy D3.js World Bank API NLG Engine Granger Causality VAR Modelling Cointegration (Johansen) HTML5 / CSS3 / JavaScript

04 Results & Impact

PulseGrid transforms raw World Bank data into publication-grade economic intelligence — automatically generating statistical analyses and narrative reports that would typically require a team of economists. The platform delivers causal insight, not just correlation, through rigorous econometric methodology.

200+ Countries Covered
60+ Years of Data
4 Statistical Engines
NLG Auto-Generated Reports

"Economic data without causal analysis is just noise with a timestamp. PulseGrid applies the rigour of econometric science to every data point — so decisions are based on mechanism, not coincidence."

— John Edoh Onuh, EDON
Your Turn

Have a complex problem that
deserves first-principles thinking?

Let's discuss how the EDON methodology can transform your most challenging engineering problem into a production-ready solution.